How long is food shelf life extended by MAP?
Modified atmosphere packaging (MAP) is known to extend product shelf life, but by how much? Read on to find out.
One of the main reasons MAP is used in the food and beverage industry is to displace oxygen. This is because when a food is exposed to oxygen, it typically begins to spoil. Oxygen affects food in this way as it allows the food to oxidise which results in biochemical spoilage. An example of this is when a food becomes rancid because its fats have oxidised.
Oxygen also enables the growth of aerobic microorganisms, resulting in microbial spoilage. An example of this is when bread becomes mouldy. MAP is used to prevent biochemical and microbial spoilage of food, which in turn extends food shelf life by prolonging the period of time that the food is safe and appealing for consumption.
However, the effects of Modified Atmosphere Packaging depend on the product being packaged. The shelf life extension provided by a modified atmosphere could be anything from days to years. Below are some examples.
| Product | Shelf life in Air | Shelf life in MAP |
|---|---|---|
| Fish and Seafood | Up to 4 days | Up to 6 days |
| Raw red meat | Up to 4 days | Up to 8 days |
| Prepared fruit and salads | Up to 5 days | Up to 10 days |
| Prepared ready meals | Up to 5 days | Up to 21 days |
| Poultry | Up to 7 days | Up to 21 days |
| Breads & pastries | Up to 14 days | Up to 12 weeks |
| Cheese | Up to 4 days | Up to 12 weeks |
| Nuts and seeds | Up to 8 months | Up to 2 years |
If you are considering MAP, you may wish to consider using nitrogen gas. Food grade nitrogen is one of the most common gases used for MAP. With a purity of 99%, it is extremely effective at displacing oxygen from packaging to prevent spoilage and extend shelf life. What’s more, food grade nitrogen can be generated on demand from a nitrogen generator.
Using a nitrogen generator to provide nitrogen for MAP ensures a continuous supply of food grade nitrogen with no supply disruptions (leading to production disruptions) caused by late gas deliveries. Another benefit of using a nitrogen generator for your gas supply is that it gives you greater control of your costs compared to using a bottled gas supply. Bottled gas suppliers often tie consumers into lengthy contracts which allow them to make frequent price increases, making a bottled gas supply difficult to factor into operational budgets. On the other hand, after the purchase of a nitrogen generator, a facility is in control of its own nitrogen supply, guaranteeing no increases in the cost of the nitrogen gas.
To discover if nitrogen gas would be suitable for your MAP application contact us today. Alternatively, if you would like to learn more about nitrogen generation click here.

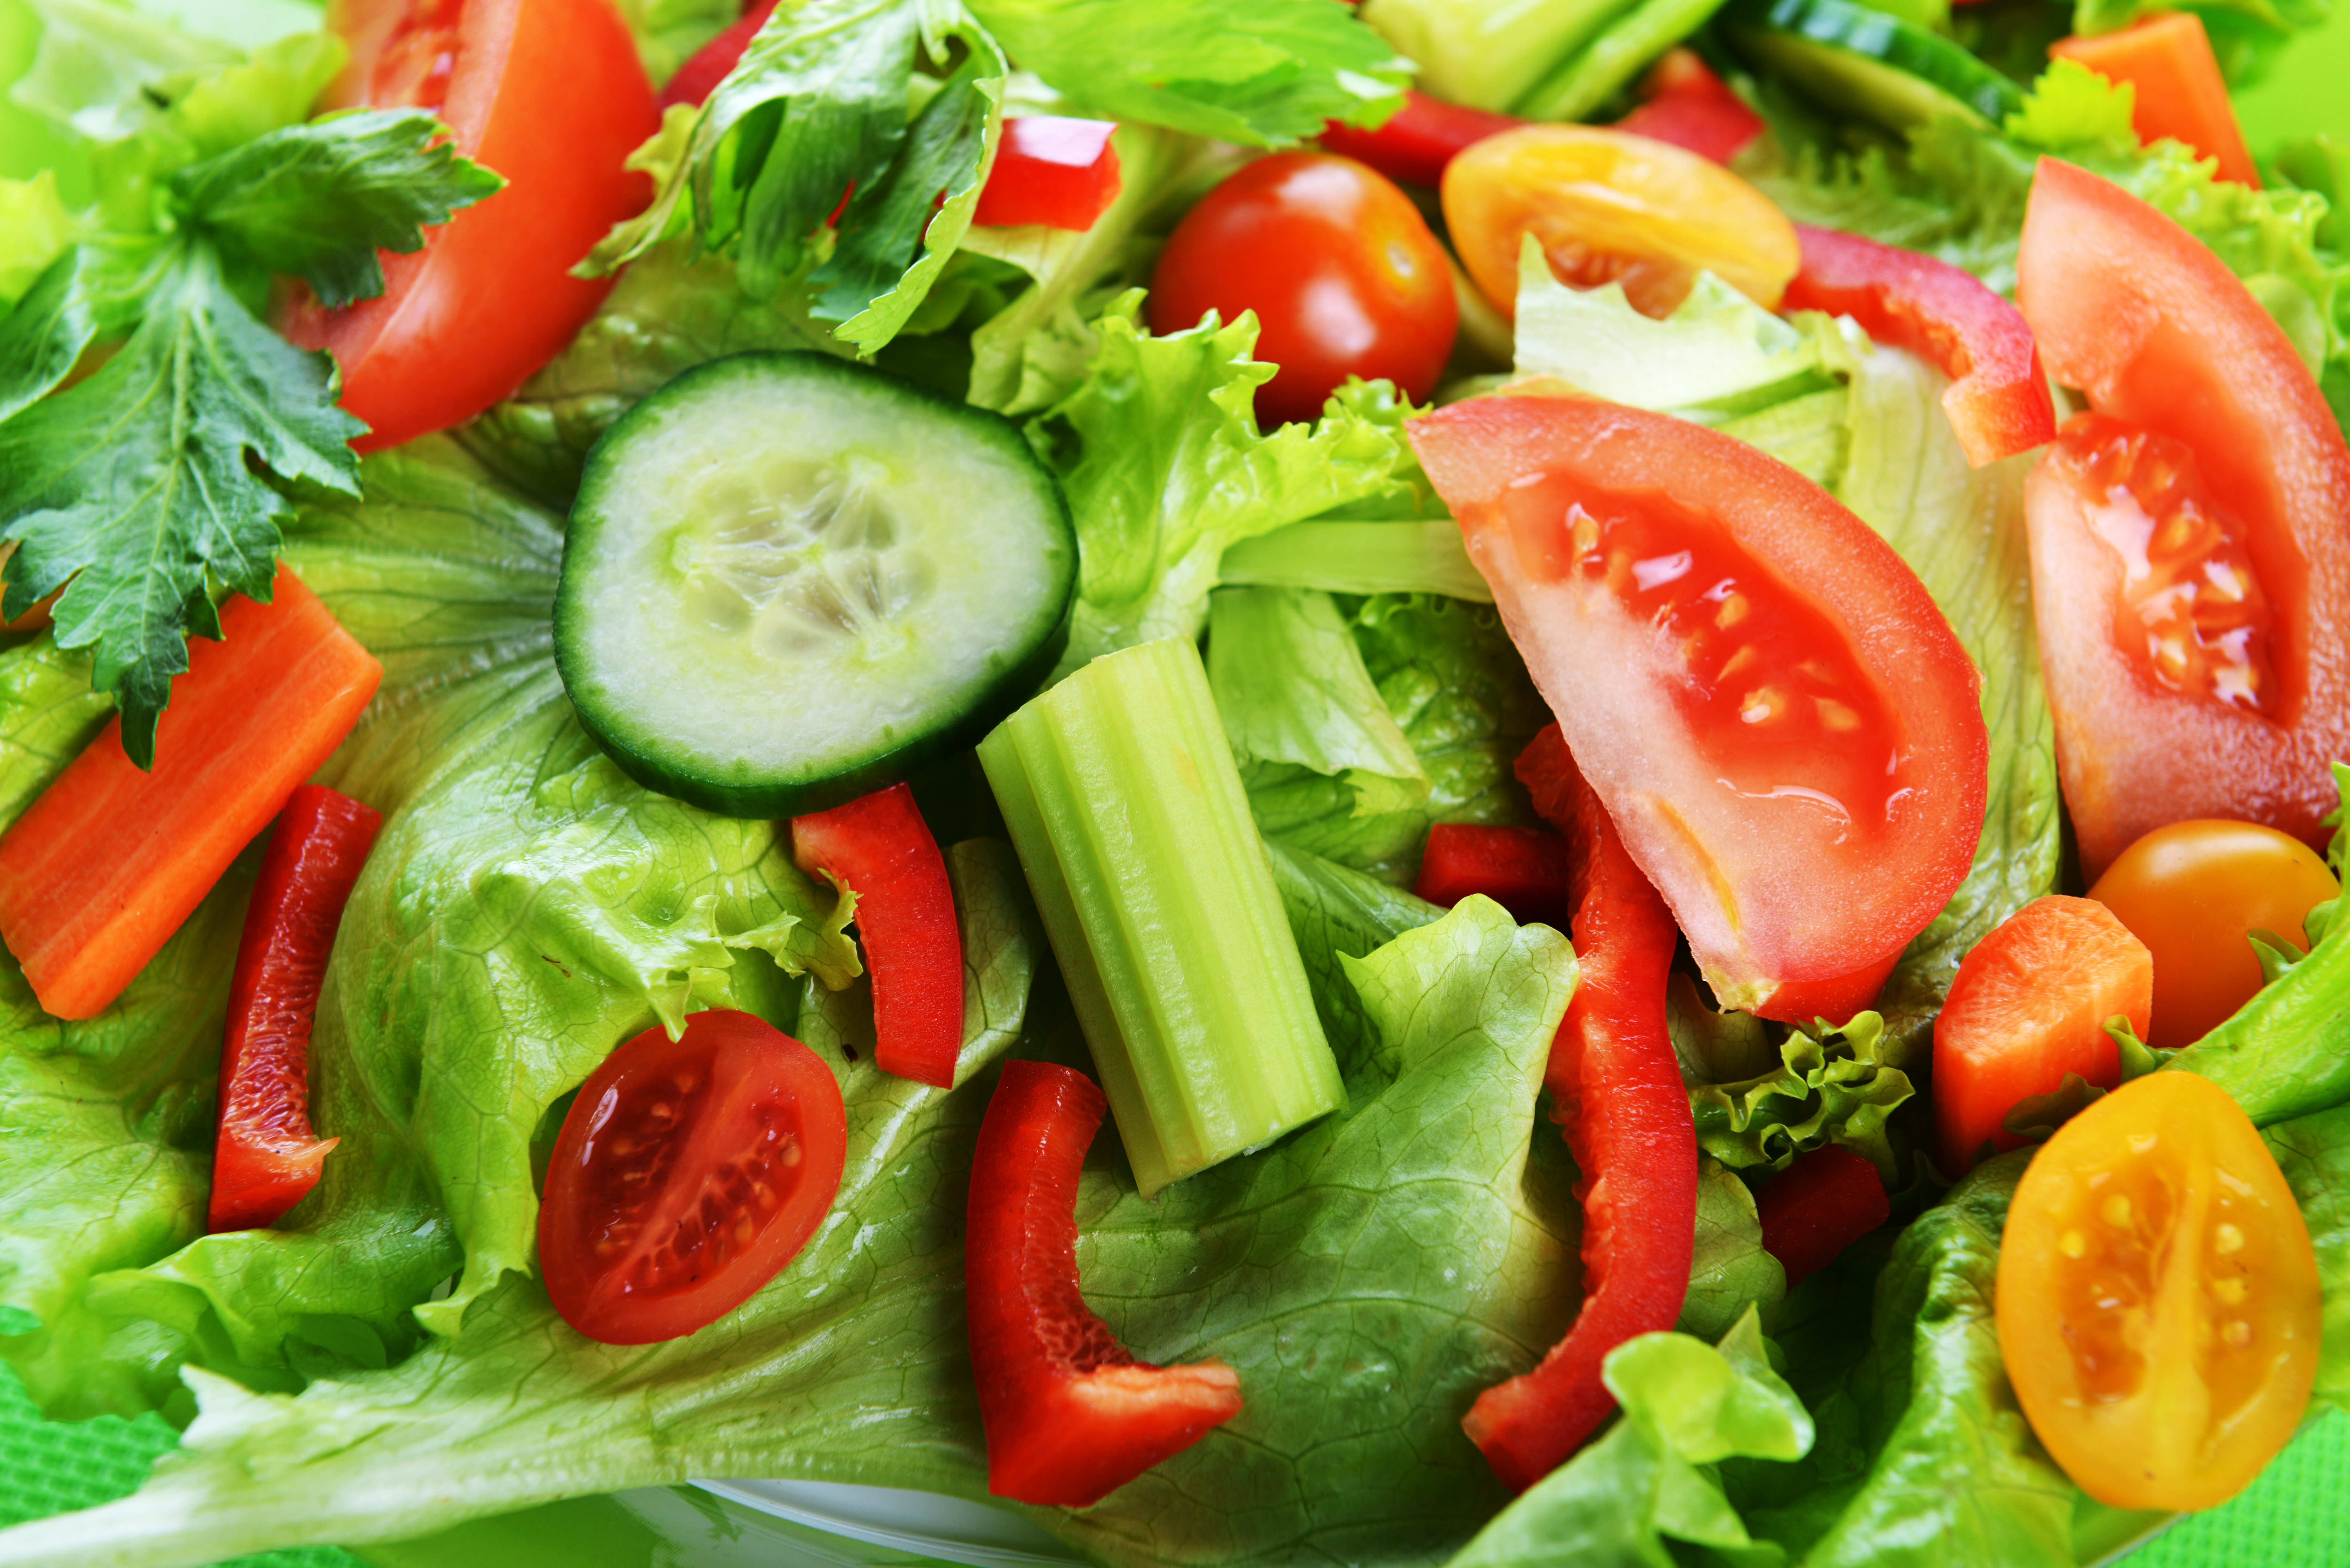
Prepared salads are often packaged in MAP
Nitrogen Generation - What does it involve?
Posted in all news on January 10 2020
As a nitrogen gas supplier, Peak Gas Generation understands every aspect of nitrogen generation…
Read MoreWhat do you need to invest in a nitrogen generator?
Posted in all news on January 31 2020
Electricity, space & ventilation. These are just some of the factors that need consideration…
Read MoreSavings Calculator
Majority of industries buy nitrogen gas supplies via nitrogen cylinder packs, others meet their needs through liquid nitrogen dewars, micro-bulk tanks or bulk liquid nitrogen delivery. There is a better, more sustainable & safer option. Reduce the cost of nitrogen gas to your organisation & become self-sufficient. Find out how much you can save with a Peak nitrogen generator system.
- liquid/bottled N2Cost of liquid/bottled N2
- InvestmentInvestment cost
- TransportTransport cost
- ServiceService cost
- LeaseLease equipment
- EnvironmentalEnvironmental Tax
- EnergyEnergy cost

